
Strategy (Research)
Project Detail
Tour AIWorkflow Builder
Commercial real estate teams evaluate dozens of potential sites at once, comparing locations, running numbers, and coordinating decisions across regional teams that rarely see the same data at the same time.
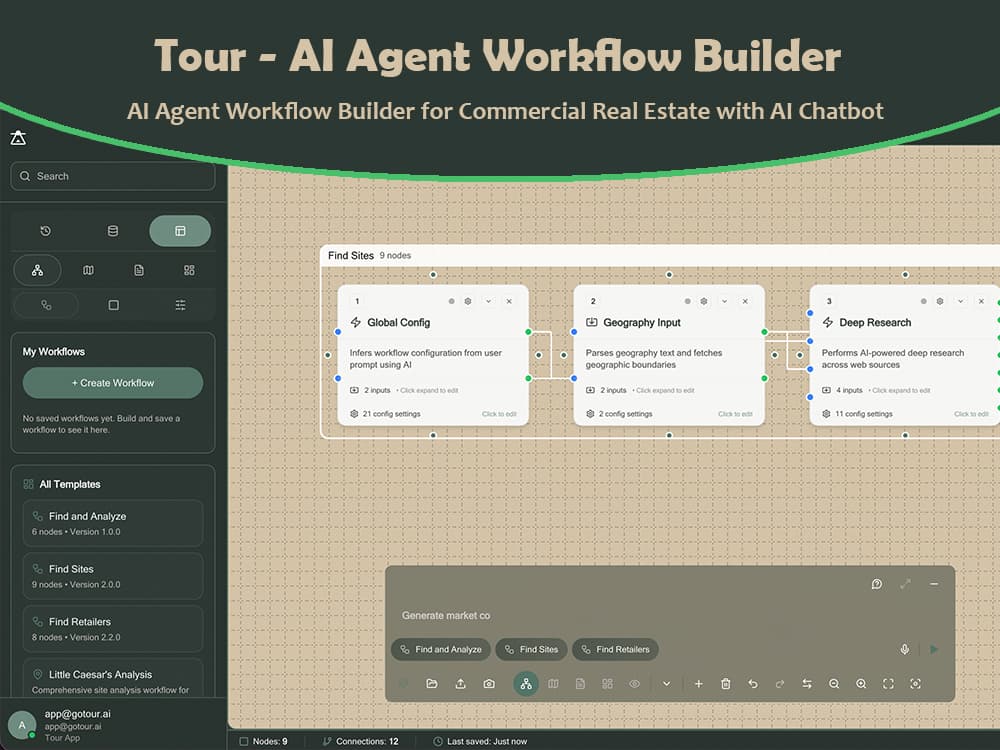
— Description:
Commercial real estate teams evaluate dozens of potential sites at once, comparing locations, running numbers, and coordinating decisions across regional teams that rarely see the same data at the same time. Tour AI turns that scattered process into a single, secure platform where a team can build, run, and visualize AI-powered workflows without needing to understand the AI underneath.
Problem
Statement
Expansion decisions in commercial real estate depend on comparing many variables, location, demographics, competing sites, lease terms, across multiple regions simultaneously. Without a shared system, that comparison happens in spreadsheets, email threads, and disconnected tools, and by the time a decision is made, the data behind it is often already stale.
Possible
Solution
We built a visual workflow builder that lets non-technical teams design and run AI-powered evaluation processes without writing code, paired with a conversational AI interface for querying site and market data in plain language. Real-time execution feedback lets a team see a workflow running and where it stands, not just its final output, while multi-tenant, role-based authentication ensures different regional teams and permission levels operate securely within one platform. Map-based insights round out the experience, visualizing site comparisons geographically rather than as raw rows in a spreadsheet.
Breakdown
FullProject Timeline
A 12-week UX-to-UI path from research and architecture through wireframes, visual design, and usability testing.
UX Design
UI Design
Interview, Empathy Map, User Journey Map
Problem Statement & Goal Statement
Competitive Analysis & Information Architecture
Paper Wireframes
Visual Design & Prototyping
Usability Testing Phase
- 1st Week
- 2nd Week
- 3rd Week
- 4th Week
- 5th Week
- 6th Week
- 7th Week
- 8th Week
- 9th Week
- 10th Week
- 11th Week
- 12th Week
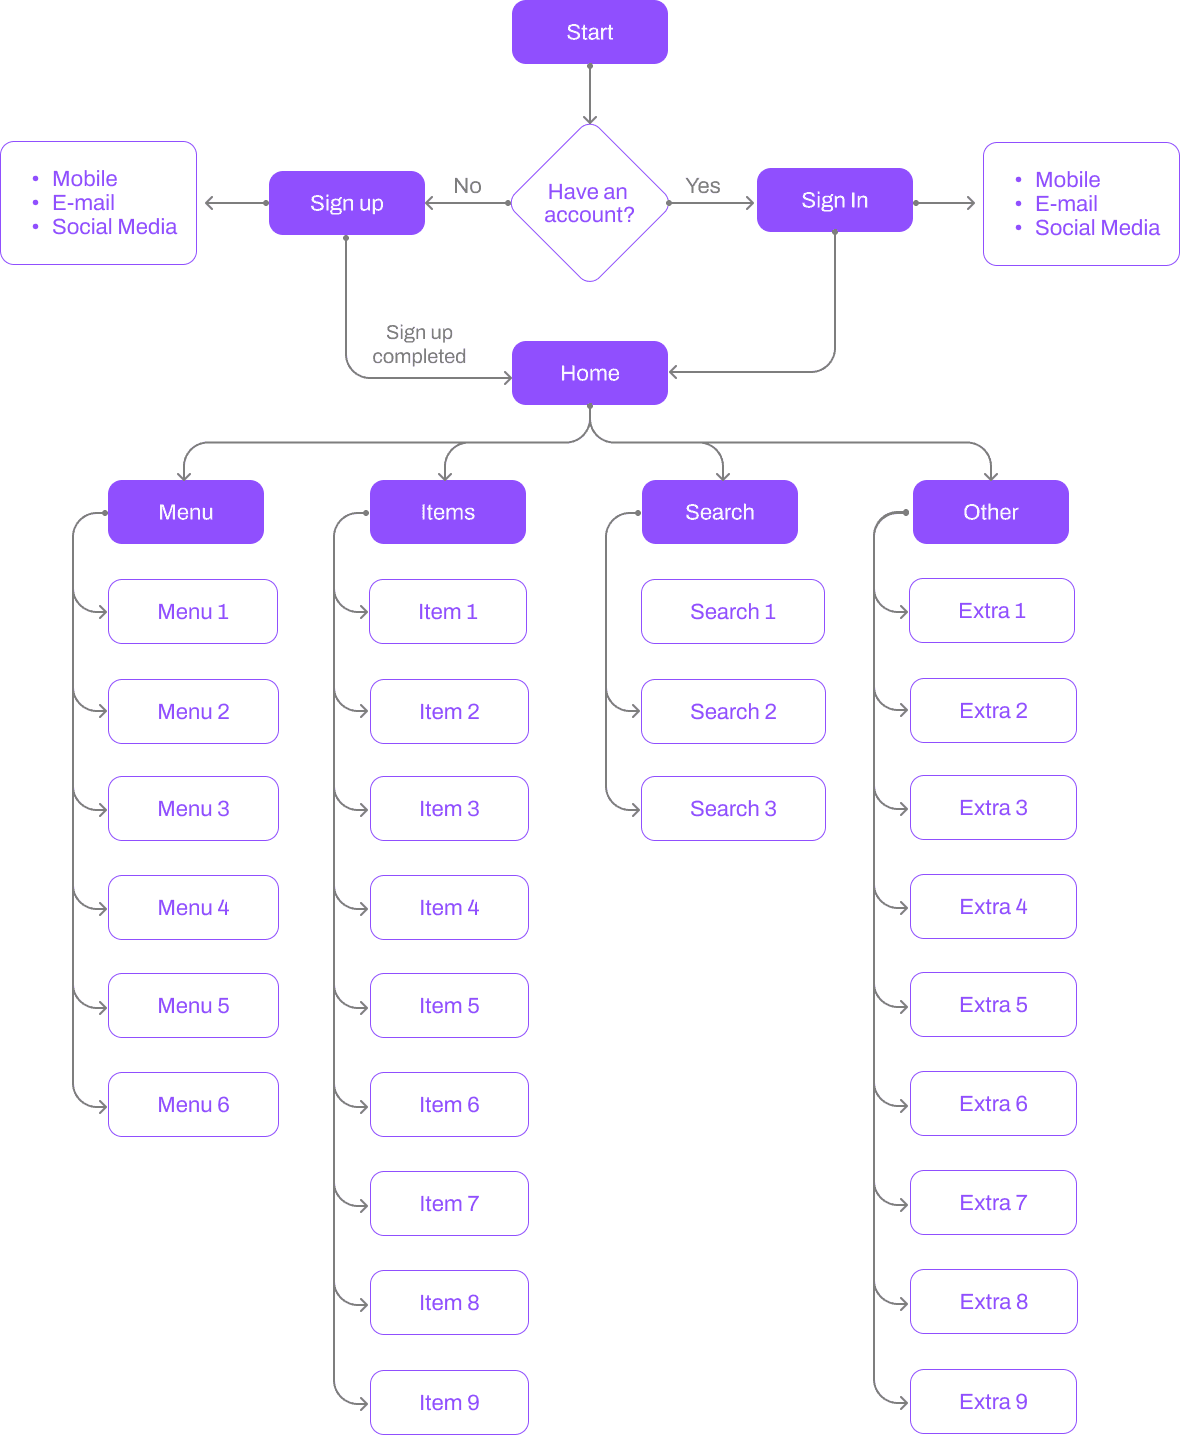
InformationArchitecture
The product map starts at authentication, lands on Home, then branches into the core destinations people actually use.
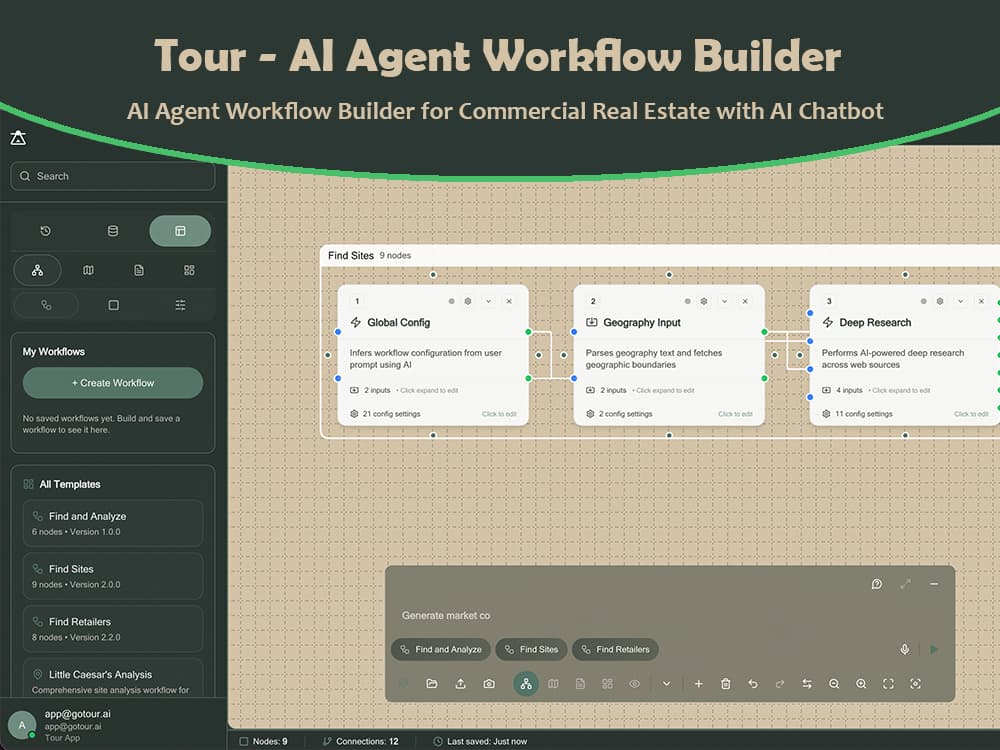
High FidelityWireframes
High-fidelity screens arranged to show the primary journeys, from first entry through the everyday product moments.
Our Work
OurWork
More projects from the studio — open a card to read the full case study.
Contact SAARZ Int.

Finding the right talent for your business can be a daunting task. Let SAARZ Int. take the guesswork out of the process and help you find the perfect fit for your team.